If you own a small business, you probably have enough going on trying to make ends meet, being bombarded by all of the various tax payments to HMRC, as well as trying to grow sustainably and meet your market demands.
The last thing you probably want to think about is the data that you are capturing and how you could use it as your superpower in your fight against the world.
In the last decade, the adage “knowledge is power” has evolved into “data is power.” For small businesses, leveraging data isn’t just a luxury; it’s a necessity for staying competitive and relevant. In this article, I want to briefly explore how small businesses can harness the power of data-driven insights to make informed decisions, enhance customer experience, and drive growth.
Understanding the Basics of Data Analysis
Data analysis, in its simplest form, is the process of examining, cleaning, transforming, and modelling data to discover useful information, inform conclusions, and support decision-making. For small businesses, this can be a game-changer. It’s not about having a wealth of data (although sometimes that can be extremely handy), but about knowing what to do with it.
There are two primary types of data: qualitative and quantitative. Qualitative data is descriptive, like customer reviews, while quantitative data is numerical, like sales figures. Both are crucial in painting a complete picture of your business landscape.
Tools and Techniques for Data Collection and Analysis
Gathering data can be as straightforward as reviewing customer feedback or as advanced as using analytical tools. For small businesses on a budget, tools like Google Analytics provide a wealth of information about website visitors and customer behaviour online. Surveys through platforms like SurveyMonkey or Google Forms are also great for collecting customer opinions and preferences.
When it comes to analysing this data, there are user-friendly tools like Microsoft Excel or Google Sheets that can perform basic to highly complex data analysis functions. These tools are great for small businesses due to their low cost but can come with a steep learning curve for those with little technical capability. But don’t fear, as long as you know the questions you are trying to answer, there are a lot of courses, videos and help guides out there to support you for free.
How do I ensure I collect the right data?
It’s very easy to get overwhelmed by the sheer volume of data available to you. Even a micro-business collects a huge amount of data, but not all data is equally valuable. The key is to focus on data that aligns with your specific business goals.
Before diving into data collection, it’s essential to have a clear understanding of your business objectives. Are you looking to increase sales, enhance customer satisfaction, or improve operational efficiency? Your objectives will determine the kind of data you need to collate. For instance, if your goal is to boost sales, you’ll want to focus on sales data, customer purchasing patterns, and market trends.
The below table identifies some of the data you can collect and considerations to make:
So I’ve got the data….now what?
If you ever did maths statistics in school, now is a good time to dust the book off the shelf. If you didn’t….well, now is a great opportunity for some personal development!
It’s time to turn your collected data into actionable insights. This doesn’t require advanced technical skills or expensive software. Here are some straightforward analysis techniques that any small business can implement:
Understanding Basic Data Analysis Concepts:
- Start with the basics like mean (average), median, and mode to understand general trends in your data.
- Use percentages to compare different segments of your business, like the proportion of repeat customers to new ones.
Visualising Data for Better Insight:
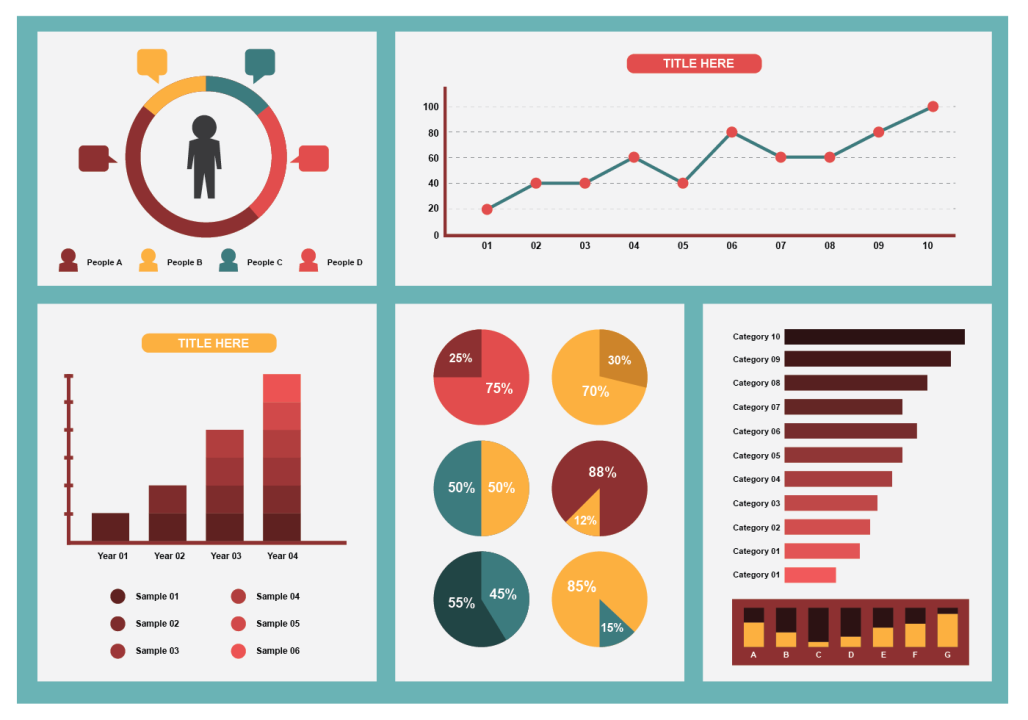
- Leverage simple graphing tools available in spreadsheet programs like Excel or Google Sheets. Creating bar charts, line graphs, or pie charts can help visualise trends and patterns in your data.
- Dashboards can be a powerful way to have a quick glance at key metrics. Many tools offer customisable dashboard capabilities that don’t require extensive technical skills.
Identifying Patterns and Anomalies:
- Look for patterns in your data over time. For instance, are sales increasing month-over-month?
- Be alert to anomalies or outliers in your data. For example, a sudden drop in website traffic could indicate an issue that needs addressing.
Segmentation for Targeted Analysis:
Break down your data into segments, such as customer demographics, product categories, or time periods. This can help you identify which segments are performing well and which need improvement.For instance, if you run a retail business, you might compare sales data between different store locations.
Correlation Does Not Imply Causation:
Remember that just because two things are correlated (like an increase in social media spending and an increase in sales), it doesn’t mean one causes the other. Be cautious about drawing conclusions without further analysis.
Acting on Insights:
Once you’ve gained insights from your data, the next step is to act on them. This might mean adjusting your marketing strategy, changing your inventory levels, or even modifying your business hours based on customer traffic patterns.
Regular Review and Adaptation:
Data analysis isn’t a one-off task. Be sure to regularly review your data to keep up with changes in your business and market. Be prepared to adapt your strategies based on new insights.
If this all sounds a bit overwhelming, don’t panic. You have several options available to you and you can always reach out to get support from a professional. If you already have an accountant, they can help you understand your financial data; a Business Analyst can help you with your processes or if you have a lot of data to churn through, think about leveraging a Data Analyst on a short-term basis to get everything set up for you.
Remember, you don’t have to do it on your own and a lot of the time, getting professional help is a lot cheaper than you think it might be, and handing the analysis onto someone else allows you to keep your focus on the day-to-day running of the business.


